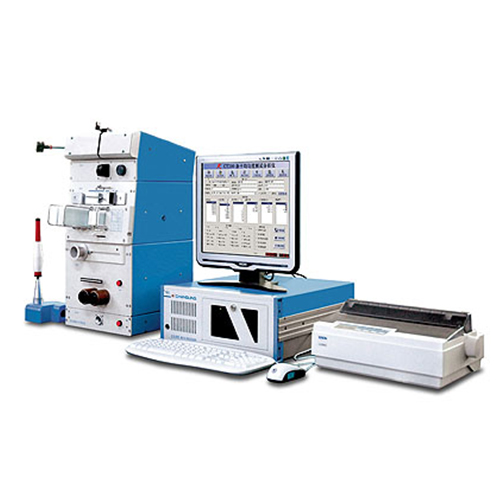

Evenness Tester is a kind of universal high-performance textile lab instrument. It is used for testing yarn unevenness and hairiness variety, which is suitable for cotton, wool, silk, flax, chemical short fiber spinning and blended yarn. It is very important to improve and guarantee yarn quality.
MAIN FEATURES
Host processor adopts PIV industrial control computer, monitor software bases on Windows platform, Chinese graphic interface, good system integration and high stability.
It can test CV% value, U% value, H value, SH value and twelve levels faults in real time.
It has various graphic indices, such as variation-length curve, unevenness curve, spectrogram, linear density-frequency distribution, etc of yarn and hairiness, which are convenient to evaluate yarn quality.
It has fine continuous spectrum and 340 channels, which are beneficial for user to analyze textile technology trouble location accurately.
Transmission system adopts imported servo system, low noise and high reliability.
Automatic zero-adjusting function improves testing efficiency, operation is simpler.
Statistical analysis system can supply annual, quarterly, monthly, daily report of specific variety testing data and statistical distribution graph of regular testing indices, which are beneficial to observe mid-long-term variation of testing indices.
Electromagnetic tensioner makes tension adjusting more convenient and reliable.
Expert system can help user analyze textile technology trouble, compare with USTER bulletin and evaluate spinning level.
It can store uneven curve and supply for users to analyze more in detail.
Automatic yarn shifting function can make trasmission roller working life longer.
Data is stored by time and variety. File system supplies various testing information, and it’s more convenient for user to check.
SPECIFICATION
Testing range yarn 4tex~80ktex, hairiness 4tex~160ktex
Yarn testing speed 4m/min,8m/min,25m/min,50m/min,100m/min
200m/min, 400m/min
Hairiness testing speed 200m/min, 400/min
Testing time freely set between 10s and 20m, take 10s as interval
Coefficient of Variation (CV%) or Unevenness (U%) and CV (1) V-L curve
CV% or U% value testing range: 0.20%~99.99%
V-L curve cutting length 1cm~1475m
Deviation Rate (DR%) and DR curve Dr value testing range 0.01%~99.99%
reference length and threshold
20cm,+35%; 20cm,-30%; 1m,+5%; 1m,-5%
Dr curve: reference length is 1cm, 10cm, 20cm, 50cm, 1m,
threshold is DR curve from 0 to 50% plus-minus
Faults value output faults value of twelve levels sensitivity at same time
thin places -30%, -40%, -50%, -60%
thick places +35%, +50%, +70%, +100%
neps +140%, +200%, +280%, +400%
Spectrogram ordinary spectrogram measurable wave-length range 1cm~2937m spectrum channels 85
fine spectrogram measurable wave-length range 1cm~2937m spectrum channels 340
Linear density frequency distribution graph two linear density frequency distribution graphs, one is within the range of -100%~+100%, one is beyond the range of +100%
Statistical function two kinds of statistical functions, one is statistics of testing data, such as Mean value, CVb, 95% confidence interval (Q95), max value, min value, etc; one is statistics of batch testing spectrogram and V-L curve by graphics mode.
Statistical distribution graph statistical distribution graph of common testing indices (CV%, H value, thin places -50%, thick places +50%, neps +200%), freely set “day” as unit of statistical time
Hairiness index hairiness (H) value, standard deviation (SH)
Hairiness graph include hairiness spectrogram, hairiness V-L curve, hairiness distribution graph, hairiness unevenness curve, etc.
COMPOSITION
It consists of detector, host processor (including monitor, keyboard, and mouse), printer, and yarn bracket.